By Farvenzo Times · Published 31 October 2026
Business / Markets explainer
What Is the KOSPI? South Korea's Stock Index Explained After Its 2026 Boom and Slide
The KOSPI is the headline index for South Korea's main stock market. It crossed 5,000, 6,000, 7,000, 8,000 and 9,000 in 2026, set a record close of 9,114.55 on 22 June, then gave back more than a third. Here is what it measures, why two chipmakers drive it, and how to read the swings.

The short answer
KOSPI stands for Korea Composite Stock Price Index. It tracks the common shares listed on the main board of the Korea Exchange, the market that is itself called the KOSPI market. The index started at a base value of 100 on 4 January 1980, so a reading of 5,730 means the combined market value it follows is roughly 57 times its 1980 starting point, before dividends.
When a newsreader says 'Korean stocks fell 3% today', this is almost always the number they mean. It is the Korean equivalent of the role the S&P 500 plays in US coverage, or the Jakarta Composite in Indonesia: one figure that summarises thousands of trades.
KOSPI, KOSPI 200 and KOSDAQ are not the same thing
Three names cause most of the confusion. The KOSPI is the broad composite of the main board. The KOSPI 200 is a narrower index of 200 large, liquid companies from that same board, weighted by the shares that actually trade (free float). It began at 100 on 3 January 1990 and is the version that futures, options and most exchange-traded funds are built on. KOSDAQ is a separate market on the Korea Exchange for younger, growth and technology companies, with its own index. A KOSDAQ company is not in the KOSPI at all.
- 01 / Base100 on 4 January 1980
- 02 / First close above 5,00027 January 2026
- 03 / Record close9,114.55 on 22 June 2026
- 04 / Close on 30 October5,730.74, about 37% below the record
Conceptual sequence, not measured data. View the static graphic.
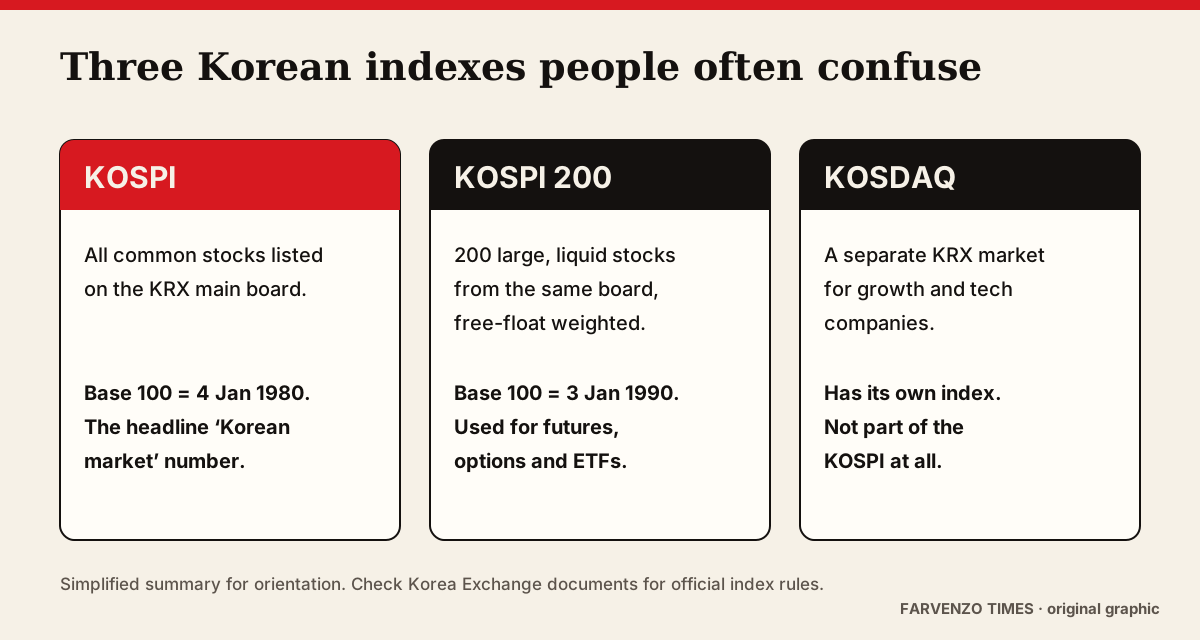
That distinction matters on volatile days. On 30 October 2026, for example, the KOSPI closed down 3.48% while the KOSDAQ fell 3.83%, according to the Seoul Economic Daily. They often move together, but they are measuring different groups of companies.
2026: the fastest climb in the index's history
The KOSPI took about 32 years to go from 1,000 (first closed above on 31 March 1989) to 3,000 (7 January 2021). It then went from 4,000 to 9,000 in less than eight months. It closed above 4,000 for the first time on 27 October 2025, above 5,000 on 27 January 2026, above 6,000 on 25 February, above 7,000 on 6 May, above 8,000 on 26 May and above 9,000 on 18 June.
The record close came on 22 June 2026 at 9,114.55, reported by Yonhap. The highest point reached during a session was 9,385.59 on 19 June, according to The Korea Times. When the index first broke 6,000 in February, The Korea Times noted it was already up more than 40% for the year, after a 75.6% gain in 2025.
Why two companies move the whole market
The engine was memory chips. Demand for high-bandwidth memory used in artificial-intelligence data centres lifted Samsung Electronics and SK hynix, and because indexes are weighted by market value, their rising share prices pulled the benchmark up with them.
By 13 May 2026 the two companies made up 51.5% of the KOSPI 200, up from 38.7% at the start of the year, according to Asia Economy: about 28% for Samsung Electronics and 23.5% for SK hynix. In practice, that means a bad day for two stocks can outweigh a good day for the other 198. Anyone reading 'the Korean market' in 2026 is reading, in large part, a verdict on the AI memory cycle.
Then the slide
The reversal was just as sharp. The Korea Times reported a fall of around 10% on 23 June, the session after the record close, as foreign investors sold chip stocks. On 28 July the KOSPI closed at 6,023.66, down 732.09 points or 10.84% in a single day, according to Asia Economy, after an 8% drop during the session had triggered a market-wide circuit breaker.
October brought another leg down. KED Global reported a seven-session losing streak, the longest in just over two years, which included a 7.6% fall to 5,554.22 on 15 October. It linked the selling to worries about how much US technology companies are spending on AI, a US tech sell-off and weak results elsewhere, including an 11%-plus fall in Kia shares. The index then swung 6.63% higher to 6,012.44 on 28 October and fell 3.48% to 5,730.74 on 30 October, the last close before publication.
That last figure is about 37% below the June record close. It is also still about 13% above the level where the KOSPI first closed above 5,000 in January. Both statements are true, which is why the starting date of any 'up' or 'down' claim matters.
How to read a big KOSPI move
- Check the start date. A fall from a record and a gain for the year can describe the same index on the same day.
- Look at Samsung Electronics and SK hynix first. With roughly half of the KOSPI 200 in two names, their moves usually explain most of the index move.
- Watch foreign flows. Korean coverage reports daily net buying or selling by foreign investors, and large outflows have accompanied the biggest falls of 2026.
- Separate the index from the currency. An overseas investor's return also depends on the Korean won against their home currency, which can add to or offset the share-price move.
- Know the safety valves. The Korea Exchange uses circuit breakers that pause trading after steep index falls, and individual shares have daily price limits, so a dramatic session may end before the selling is exhausted.
What the KOSPI does not tell you
An index level is not a valuation. A KOSPI at 5,700 can be cheap or expensive depending on company earnings, and a record close says nothing on its own about whether the run will continue. The headline KOSPI figure is also a price index: dividends are not added back in, so it understates what a long-term holder actually earned.
Nor does it describe Korea's whole economy. Households, exporters and small firms outside the chip supply chain can have a very different year from the index. For how a strong headline can sit beside a weak household experience, see our explainer on GDP growth and the household squeeze.
Sources
- The Korea Times: KOSPI surpasses 6,000 to close on new high (25 Feb 2026)
- The Korea Times: KOSPI slips from record high; intraday peak 9,385.59 (19 Jun 2026)
- Yonhap via NewKerala: Seoul shares close at fresh peak above 9,100 (22 Jun 2026)
- The Korea Times: foreign sell-off in chip stocks drags KOSPI down (23 Jun 2026)
- Asia Economy: Samsung Electronics and SK hynix reach 52% of KOSPI 200 (14 May 2026)
- Asia Economy: KOSPI closes at 6,023.66, down 10.84% (28 Jul 2026)
- KED Global: KOSPI sinks as tech sell-off spreads (30 Oct 2026)
- Seoul Economic Daily: KOSPI closes down 3.48% at 5,730.74 (30 Oct 2026)
- Seoul Economic Daily: KOSPI jumps 6.63% to 6,012.44 (28 Oct 2026)
- KOSPI milestones and base date (Wikipedia summary of Korea Exchange data)
Keep exploring
- IHSG Explained: Reading Indonesia’s Composite Stock Index →
Learn what Indonesia’s IHSG measures, how index weights affect the headline, and why market breadth and your own investment returns can differ.
- Why GDP Growth Can Coexist With a Household Squeeze →
An economy can produce more while many households still struggle. Output, income distribution, living costs and debt payments measure different parts of the experience.
- What Is a K-Shaped Economy? The Data Behind the 'It's Over' Debate →
A K-shaped economy is one where some households pull ahead while others fall behind at the same time. In August 2026 Treasury Secretary Scott Bessent declared it over; many economists disagree. Here is what the term means, what the data says, and how to tell which arm you are on.