Global business & economics
Why GDP Growth Can Coexist With a Household Squeeze
An economy can produce more while many households still struggle. Output, income distribution, living costs and debt payments measure different parts of the experience.
By Farvenzo Explained · Published · Sources checked 24 October 2026 · 2 min read

A supermarket aisle photographed in 2013. Archival context for household purchases, rather than a measure of current prices or GDP.
Photo: Lars Frantzen · Supermarket full of goods.jpg / source · CC BY-SA 4.0.
Resized and converted to WebP; full frame retained. No filters, overlays or content edits by Farvenzo. Article-list thumbnails use a display crop. Farvenzo’s photographic renditions are available under the same CC BY-SA 4.0 licence.
An aggregate is not a household budget
GDP measures production within an economy. Real GDP adjusts for price changes, making it useful for studying output growth. The IMF cautions that GDP does not by itself measure overall wellbeing or show how gains are distributed.
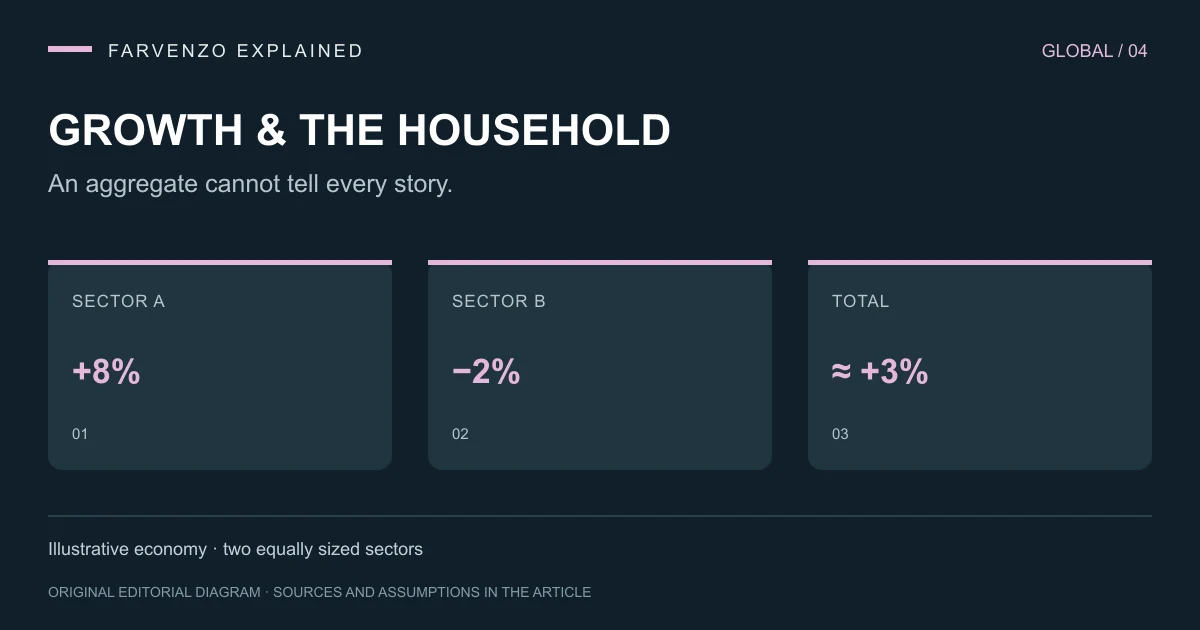
Imagine a small fictional economy with two equally sized sectors. One expands 8% and the other contracts 2%; overall output rises approximately 3%. A worker in the shrinking sector may face fewer hours even though the national headline is positive. The example illustrates aggregation, not conditions in a named country.
Population changes the comparison
Total production and production per person can move differently. Suppose real output rises from 100 to 103 units while population rises from 100 to 104 people. Output per person slips from 1 to about 0.9904 units. Total growth is positive, but the per-person comparison is slightly negative.
GDP per person still is not the typical pay cheque. It is an average of production, and an average cannot reveal the full distribution. Look for household-income and wage measures alongside GDP, and check whether those measures are adjusted for inflation.
Old price increases remain in the budget
A lower positive inflation rate means prices are rising more slowly; it does not mean the earlier increases have disappeared. If a fictional shopping basket rises from 100 to 110 and then by another 2%, it costs 112.20. A household whose income has not kept pace still feels the squeeze.
Different households also buy different baskets. Rent, food, transport and heating take different shares of each budget. The same average inflation rate can describe very different pressures. A homeowner with fixed housing costs and a renter negotiating a new lease need not experience the headline similarly.
Use a small dashboard of questions
Ask four questions: is real output growing; is real output per person growing; are typical household incomes keeping pace with living costs; and what is happening to employment and hours? For a personal budget, add actual housing and debt payments. No single indicator answers all five.
For a business owner, the same distinction helps interpret demand. National growth can coexist with weak sales in a particular neighbourhood or customer group. Match the scale of the evidence to the decision. Aggregate statistics describe the wider economy; your customers’ budgets determine what they can buy from you.
Keep exploring
YouTube RPM vs CPM: Why the Bigger Number Is Not Your Pay · Why Falling Inflation Does Not Mean Prices Are Falling
Sources
Keep exploring
- YouTube RPM vs CPM: Why the Bigger Number Is Not Your Pay →
CPM describes advertiser spending per thousand ad impressions. RPM describes creator revenue per thousand relevant views. Their different denominators make direct comparisons misleading.
- Why Falling Inflation Does Not Mean Prices Are Falling →
Inflation measures the pace of price increases. When that pace slows but stays positive, the price level keeps rising—and earlier increases remain in the shopping basket.