By Farvenzo Times · Published 31 October 2026
Politics / Economy explainer
What Is a K-Shaped Economy? The Data Behind the 'It's Over' Debate
A K-shaped economy is one where some households pull ahead while others fall behind at the same time. In August 2026 Treasury Secretary Scott Bessent declared it over; many economists disagree. Here is what the term means, what the data says, and how to tell which arm you are on.

The idea in one picture
Draw the letter K. The vertical stroke is a shared starting point. From there, one arm rises and the other falls. Economists use the image when two large groups of people experience the same period in opposite ways: one group's income and wealth keep climbing, while the other's stall or shrink.
The phrase became common during the recovery from the 2020 pandemic recession, when people who could work from home and owned shares did well while many service workers lost jobs. It never fully went away. Through 2025 and 2026 it became shorthand for a familiar complaint: the headline numbers look fine, so why does it feel so tight?
Why it is a political argument in 2026
On 4 August 2026, Treasury Secretary Scott Bessent told CNBC: "I can say here definitively, the K-shaped economy is over." He cited Bureau of Labor Statistics data showing the bottom quarter of wage earners getting 5.5% year-over-year pay rises, which he described as three times the gain at the top, and said the economy was becoming 'C-shaped'.
- 01 / WagesBottom quartile up 5.5%, but overall pay 3.2% vs 3.4% inflation
- 02 / WealthTop 1% hold 32.5% of net worth; bottom 50% hold 2.3% (Q2 2026)
- 03 / SpendingCard spending per household up 6.2% in September 2026
Conceptual sequence, not measured data. View the static graphic.
PBS NewsHour then asked economists whether they agreed. Several did not. Lazard chief executive Peter Orszag called the declaration "a little bit premature". NYU economist Mark Gertler described a "tilted K", in which real wages rose slightly more for lower-income workers while a booming stock market mainly benefited higher-income households. National Retail Federation chief economist Mark Mathews said the K shape persists, although lower-income consumers had increased their spending.
Because the claim comes from an administration official and the rebuttals from economists and think-tank researchers, the term is now used as much to score points as to describe data. The useful question is narrower: which measure is each side looking at?
Wages, wealth and spending tell different stories
Wages. The bottom-quartile figure Bessent cited is real, and it is good news for lower-paid workers. But PBS noted that overall wage growth had slowed to 3.2%, below the 3.4% inflation rate at the time. A raise that trails prices is a pay cut in real terms, which is why falling inflation does not mean prices are falling.
Wealth. This is where the K is clearest. According to the Federal Reserve's Distributional Financial Accounts, the top 1% of US households held 32.5% of all household net worth in the second quarter of 2026. The bottom half held 2.3%. Wealth gains come mostly from assets such as shares and property, and those had a strong run. Households with few assets cannot benefit from that, however fast their wages grow.
Spending. Bank of America Institute data points the other way. Card spending per household rose 6.2% year on year in September 2026, and the institute described an ongoing recovery in spending growth among lower- and middle-income households. PBS also cited Bank of America and PNC reports showing a narrowing spending gap, although PNC said the K-shaped dynamic persists.
Is the US in a K-shaped economy right now?
On the evidence available at the end of October 2026, the honest answer is: partly. The gap in wage growth has narrowed in lower-paid workers' favour. The gap in wealth remains extreme. Spending by lower-income households has recovered, but PBS also reported that credit-card debt is up 60% from five years ago, so some of that spending is borrowed. If you are reading a confident claim either way, check which of those measures it relies on.
How long does a K-shaped economy last?
There is no fixed timetable, because it is a description, not a formal economic phase like a recession. The arms come back together when lower earners' real incomes rise faster than living costs for long enough to rebuild savings, or when asset prices fall and the top arm flattens. A sharp stock-market correction narrows the wealth gap on paper, but it is not the kind of convergence anyone hopes for.
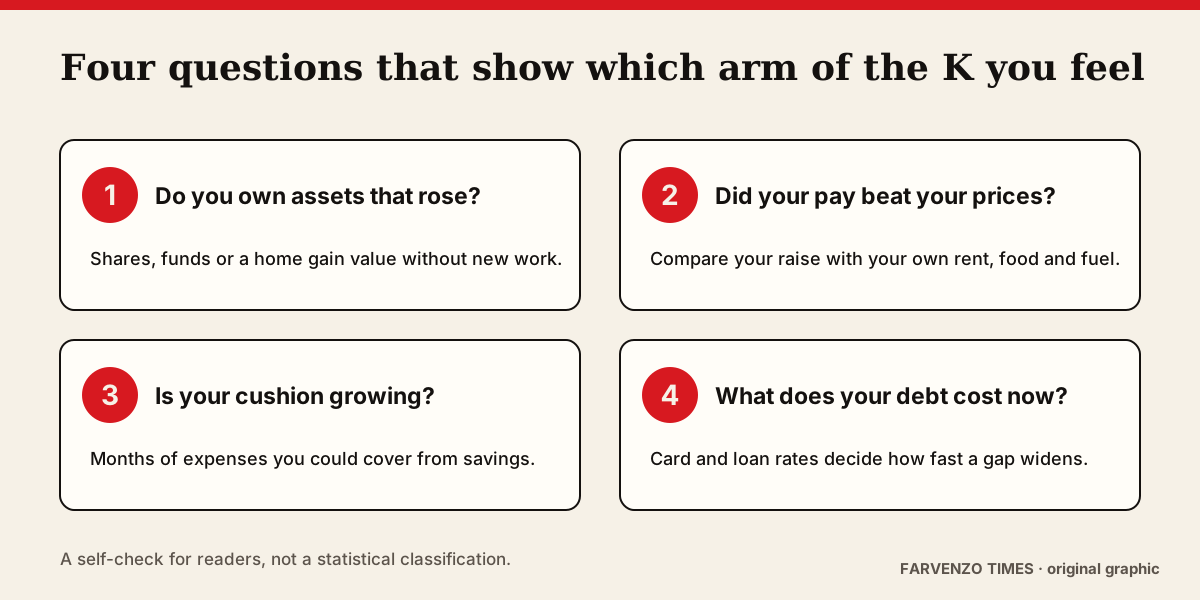
Four questions that show which arm you are on
- Do you own assets that rose? Shares, pension funds or a home that gained value add wealth without extra work.
- Did your pay beat your prices? Compare your raise with what your own rent, food and fuel actually cost now, not the national average.
- Is your cushion growing? Count how many months of essential spending your savings could cover, and whether that number is rising.
- What does your debt cost now? High-rate card balances and buy now, pay later plans can widen a gap faster than a raise closes it.
None of these questions needs a political answer. They turn an abstract debate into a personal check, which is where the K actually matters.
What to watch next
Three releases will show whether the arms are converging. The Federal Reserve updates its wealth-distribution accounts each quarter. Monthly inflation and pay data show whether real wages are rising. Card-spending reports from large banks show whether lower-income households are spending from income or from credit. When all three point the same way, the argument will be easier to settle.
Sources
- PBS NewsHour: Bessent said the K-shaped economy is over. Here's what financial experts say (12 Aug 2026)
- Fortune: Bessent declares the K-shaped economy over; data would beg to disagree (5 Aug 2026)
- Marketplace: Is the K-shaped economy over? (10 Aug 2026)
- FRED: share of net worth held by the top 1% (WFRBST01134)
- FRED: share of net worth held by the bottom 50% (WFRBSB50215)
- Bank of America Institute: Consumer Checkpoint, October 2026
Keep exploring
- Why Falling Inflation Does Not Mean Prices Are Falling →
Inflation measures the pace of price increases. When that pace slows but stays positive, the price level keeps rising—and earlier increases remain in the shopping basket.
- Why GDP Growth Can Coexist With a Household Squeeze →
An economy can produce more while many households still struggle. Output, income distribution, living costs and debt payments measure different parts of the experience.
- Buy now, pay later: the small-payment trap →
The payment is smaller. The purchase is still the same size.