By Farvenzo Times editorial team · Published 26 October 2026 · Sources checked 26 October 2026 · 2 min read
Politics / Explainer
A Poll Lead Is Not a Win Probability: How to Read the Margin of Error
A small gap in an opinion poll needs context about the sample, timing and uncertainty. The headline difference is neither an election result nor a candidate’s chance of winning.

Begin with the question the survey can answer
A poll measures responses from a sample under a particular design. Its interpretation depends on whom the researchers tried to represent, when they interviewed people and the wording used. Pew Research Center’s guidance asks journalists to distinguish populations such as all adults, registered voters and likely voters rather than treating their results as interchangeable.
A useful first step is to write the population and fieldwork dates beside the headline. A national opinion estimate and the outcome of a contest decided across particular constituencies are different objects. Moving from one to the other requires additional assumptions; a percentage does not make those assumptions disappear.
Percentage points are not probabilities
Imagine an invented survey reporting 48% for A, 46% for B and 6% elsewhere or undecided. A’s observed lead is two percentage points: 48 minus 46. That calculation does not produce a 48% chance of winning, a 2% chance of losing, or a final allocation of the undecided respondents.
- 01 / Support shareA fictional 48% response estimate
- 02 / Observed lead48% − 46% = 2 percentage points
- 03 / Win probabilityRequires a separate forecasting model
Conceptual sequence, not measured data. View the static graphic.
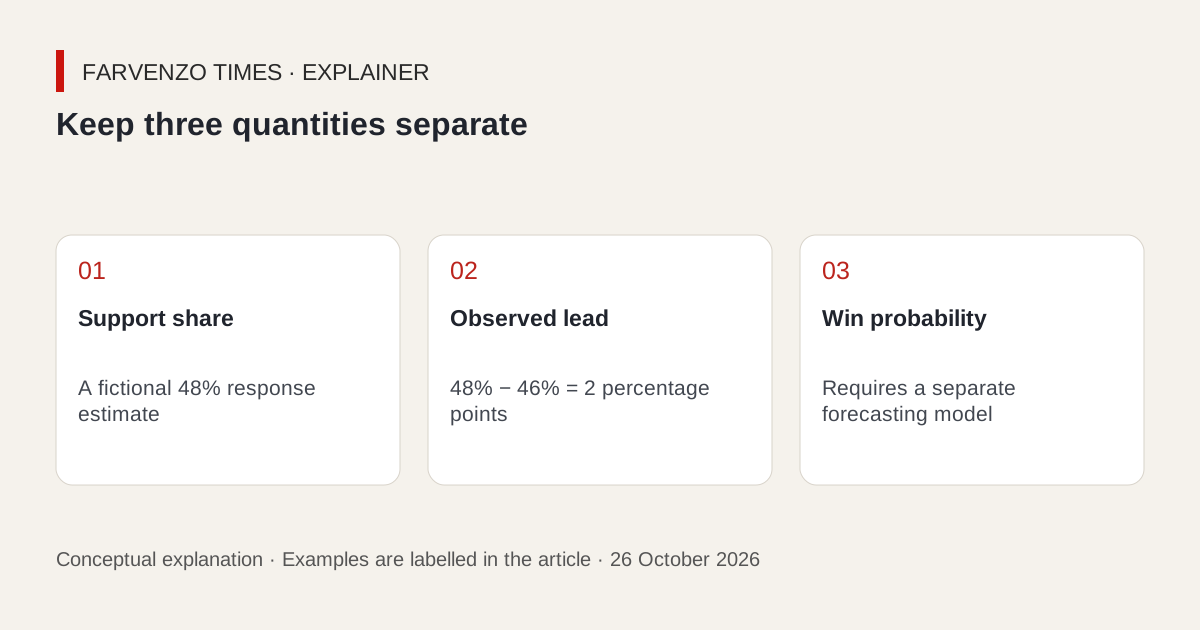
The distinction matters even before assessing the poll’s quality. Support shares describe the survey estimate. A win probability belongs to a forecasting model with its own inputs and assumptions. Treating either as a guarantee turns uncertainty into an assertion the number never made.
The comparison has its own uncertainty
Pew’s margin-of-error explainer shows that uncertainty around the difference between two candidates can be larger than the reported margin for either candidate alone. Its illustrative three-point individual margin becomes roughly six points for the difference. That is an example, not a universal rule for every survey design.
Do not mechanically subtract the published margin from the leader and call the remainder a secure lead. Ask whether the pollster reports uncertainty for the comparison you are making. Smaller subgroups, different weighting and different designs can require different treatment.
Sampling error is only one part of the picture
Pew also cautions that the usual sampling margin does not capture every possible error. Who responds, how people interpret a question and how a sample is adjusted can affect the result. A narrow interval is not a certificate that every source of bias has been removed.
For a fictional news comparison, one poll taken earlier among adults and another taken later among likely voters cannot establish a precise change simply because their headline numbers differ. First compare the populations, questions and methods. If those are not comparable, describe the limitation instead of inventing a trend.
Read a poll as a dated piece of evidence. Look for methodological disclosure, compare like with like and distinguish an observed gap from a supported conclusion. This article makes no prediction about any current election or candidate.
Sources
Keep exploring
- Why GDP Growth Can Coexist With a Household Squeeze →
An economy can produce more while many households still struggle. Output, income distribution, living costs and debt payments measure different parts of the experience.