By Farvenzo Times · Published 3 November 2026 · Sources checked 3 November 2026 · 4 min read
Money basics / UK tax mechanism explainer
Personal Allowance Frozen: How Fiscal Drag Changes Your Take-Home Pay
A pay rise can leave you paying a larger share of your salary in Income Tax even when the headline tax rates stay the same. Fiscal drag describes what happens when earnings move ahead of allowances and thresholds. Understanding it starts with the bands, not a headline about your entire salary.
Use the right tax year and country
HMRC identifies the current tax year as 6 April 2026 to 5 April 2027. Its guide gives a standard Personal Allowance of £12,570. With that full allowance, employment income in England, Wales and Northern Ireland reaches the 40% band above £50,270. Scotland has different employment-income bands. These are current-year facts, not a prediction of a future Budget.
The Office for Budget Responsibility explains the mechanism: when earnings rise faster than thresholds, more income becomes taxable or enters higher bands. A freeze can therefore increase the average tax share without changing the percentages printed beside the bands. That explanation does not tell us how much every household will pay.
The October 2026 Budget also sets out a separate Pension Tax Allowance proposed from 6 April 2027 for eligible people at or above State Pension age. HMRC describes it as a reduction in tax liability, subject to income conditions, rather than an increase in everyone’s Personal Allowance. It does not change the 2026–27 employment example below. Future savings-income rates likewise need their own tax-year calculation.
Follow an illustrative £2,000 raise
Imagine an employee in England whose only income is salary, who receives the full standard allowance and has no reliefs or other adjustments. Compare annual salaries of £50,000 and £52,000 under the same 2026–27 rules. This isolates Income Tax; it excludes National Insurance, pension deductions, student loans and benefits.
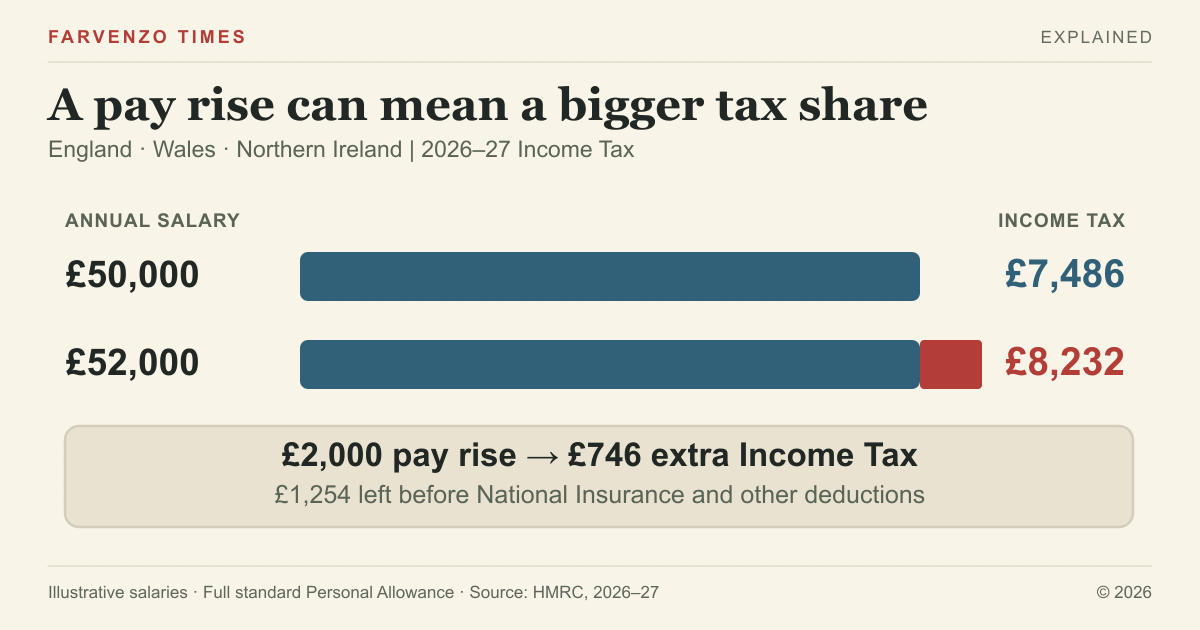
- At £50,000, subtract £12,570. Taxable income is £37,430, all within the 20% band. Income Tax is £7,486.
- At £52,000, taxable income is £39,430. The first £37,700 attracts £7,540 of tax; the remaining £1,730 attracts £692 at 40%. Total Income Tax is £8,232.
- The raise adds £746 of Income Tax, leaving £1,254 before the other deductions excluded from this example.
The additional tax is 37.3% of the £2,000 raise, because £270 falls in the basic-rate band and £1,730 in the higher-rate band. It is not 40% of the employee’s whole salary. Their average Income Tax share rises from about 14.97% to 15.83%. Marginal tax on additional earnings and average tax on total earnings measure different things.
What would moving the thresholds change?
Now use a fictional comparison, not an alternative legal tax schedule. If the allowance and basic-rate limit both rose by the same 4% as that salary, they would become £13,072.80 and £39,208. Taxable income at £52,000 would be £38,927.20, giving £7,785.44 of Income Tax at 20%. The difference from the frozen-threshold calculation is £446.56.
That comparison makes the threshold effect visible: the earnings number is identical, while the assumed band boundaries change. It does not estimate government revenue, promise an entitlement or establish what the employee’s employer will deduct each month. Those require their own records and rules.
A bigger net amount can still buy less
After Income Tax alone, the first salary leaves £42,514 and the second £43,768, a rise of about 2.95%. If this person’s costs hypothetically rose 4%, purchasing power on that simplified basis would fall by about 1.01%: divide 43,768 by 42,514, then divide by 1.04. Neither assumed inflation nor this salary describes the UK workforce as a whole.
Apply the distinction to your actual records
Read an earnings increase alongside your tax year, residence, taxable income and actual allowance. HMRC reduces the allowance above £100,000 of adjusted net income; different income types can have different rules. Check the official guidance and your tax record before using a simplified example to explain a payslip. Fiscal drag is a mechanism, not a complete calculation of anyone’s finances.
Sources
Keep exploring
- The three-bucket budget: give payday a plan →
Separate essentials, future goals and everyday enjoyment.
- How Much Should You Save Each Month? Work Backwards From Your Goal →
The most useful savings number is the amount that gets a specific goal paid for by a specific date. Here is how to work it out in five steps, with examples you can check in a free calculator.
- Government Debt and Bond Vigilantes: Why Yields Matter →
Learn how government borrowing, bond prices and yields connect, why mortgage rates can move differently from policy rates, and what bond vigilantes means.