Behavioral Psychology & Decision Science
Prospect Theory Without the Two-to-One Myth
Prospect theory describes patterns in choices under risk that expected-utility models did not explain well. In Kahneman and Tversky’s 1979 formulation, outcomes are evaluated as gains and losses relative to a reference point, and decision weights do not equal objective probabilities. Their 1992 cumulative prospect theory refined the weighting treatment and extended the account. The theory is descriptive: it models how people may choose, not how they should invest or what any asset is worth. Popular summaries often claim that every person experiences a loss as exactly twice an equivalent gain. That is not a universal law. Estimated parameters vary by study, task, population and model. The useful lesson is to inspect the reference point, framing and probability treatment before interpreting a financial decision.
By Farvenzo Explained · Published · 6 min read
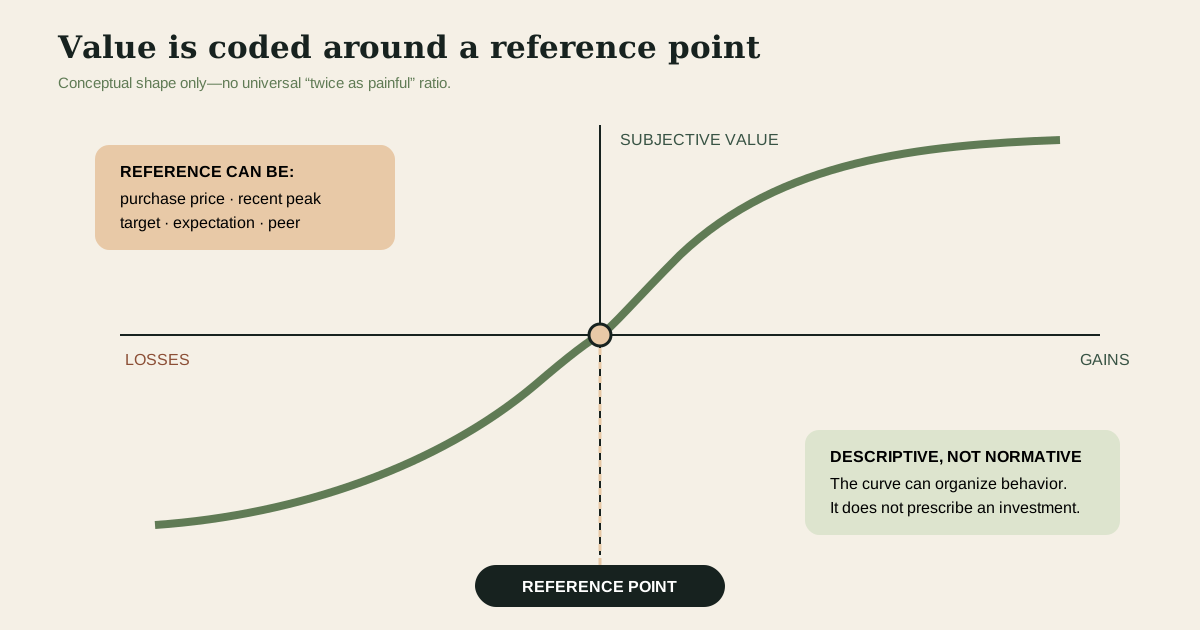
A reference point converts outcomes into gains and losses
Traditional analysis often evaluates final wealth. Prospect theory emphasizes change from a reference. A $5,000 portfolio decline can feel like a loss relative to yesterday’s balance, a smaller gain relative to the amount originally invested, or evidence of being below a target. The same final state may therefore be coded differently depending on the reference. References can arise from purchase price, recent peak, expectation, peer comparison, budget or a communicated forecast. They are psychologically influential without becoming economically privileged; a purchase price does not determine an asset’s future cash flows.
Reference points also move. A bonus first presented as likely and later withdrawn may be experienced as a loss even if total pay remains above last year. A temporary market gain can become a new mental baseline. This adaptation complicates measurement because researchers and decision-makers may assume different references. A careful analysis states the candidate reference and asks how the choice looks under alternatives. If a project is evaluated only against its optimistic launch forecast, a smaller positive return may be labeled failure; against the next-best use of capital, it may still be attractive.
The value function is conceptual, not a universal pain meter
Prospect theory represents subjective value with a function that is generally concave over gains, convex over losses and steeper on the loss side around the reference point. That shape captures diminishing sensitivity and loss aversion in the model. It does not establish a physiological unit of pain, nor does one fitted slope ratio apply to everyone and every scale. A small experimental gamble, a house sale and a pension decision differ in stakes, experience and institutional context. Parameter estimates are conditional on the model and data used to estimate them.
Diminishing sensitivity means the perceived difference between $0 and $100 may loom larger than the difference between $10,000 and $10,100, all else equal. Over losses, the convex segment can help describe risk seeking in some framed loss choices, such as preferring a chance to avoid a sure loss. Real behavior is not guaranteed to follow the textbook shape. Liquidity, goals, beliefs, taxes and constraints can dominate. The curve is a device for organizing evidence, not a diagnostic test for a person and not a forecast of market prices.
Probability weighting is different from loss aversion
People may give decision weight to probabilities in a nonlinear way, often overweighting some small probabilities and underweighting some moderate or large probabilities in experimental settings. This helps explain the attraction of both lottery-like payoffs and insurance against rare losses without claiming that every buyer miscalculates. Cumulative prospect theory applies weights to ranked cumulative outcomes, avoiding problems in the original formulation for gambles with many outcomes. The technical distinction matters because a choice can be driven by treatment of probability even when the outcomes are all gains.
Communication can amplify weighting effects. Saying a risk is “one in a hundred” may evoke a different response from “99 percent do not experience it,” despite mathematical equivalence. Vivid stories can make a low-probability event easier to imagine, while an aggregate percentage can hide who bears the loss. Decision support should show frequencies, denominators and ranges, and should not exploit salience. Where probabilities are estimates rather than known frequencies, model uncertainty should be shown separately. A precise-looking percentage does not remove uncertainty about the process that generated it.
Worked example one: two employees frame the same bonus differently
Institutions can create reference points intentionally or accidentally through targets, dashboards and labels. Reporting a fund as “down from its peak” foregrounds one comparison; reporting it relative to mandate or liabilities foregrounds another. Neither frame should conceal the absolute position. Committees can request a standard dashboard showing current value, contributions, benchmark, goal progress and downside scenarios. Multiple views reduce the chance that one salient reference dictates action, while written minutes reveal whether the stated rationale changed after an outcome became known.
An illustrative company tells employees that a performance bonus will probably be $8,000, then pays $6,000 after a weaker quarter. Employee A compares the payment with last year’s $4,000 and experiences a $2,000 gain. Employee B adopted the communicated $8,000 as the reference and experiences a $2,000 loss. Both receive the same cash. Their different reactions do not prove either is irrational; the organization helped establish an expectation. Management should separate a forecast from a commitment and explain the rule before outcomes are known.
If the company studies retention, it should not label B “loss averse” from one response. It could examine how the expectation was communicated, whether peers received different information, and whether the formula was trusted. A fair redesign might provide a range and the variables that determine payment. The worked case illustrates descriptive use: reference-dependent value helps explain dissatisfaction that final-wealth analysis misses. It offers no normative answer about the correct bonus, which still depends on contract, performance, fairness and business conditions.
Worked example two: a holding below its purchase price
Imagine an investor bought an asset at $50 and later observes a price of $38. Selling crystallizes a $12 loss relative to purchase, so the investor feels drawn to wait until the price “gets back” to $50. Another asset with similar risk and a stronger evidence-based outlook is available. Prospect theory identifies the purchase price as a possible reference and explains why realizing the loss may be aversive. It does not say whether the first asset should be sold, held or bought; that requires analysis of value, risk, tax, liquidity and objectives.
A process safeguard is to write the decision as a fresh allocation question: given current resources and constraints, how should the exposure be evaluated now? That question does not erase taxes, transaction costs or portfolio interactions. It simply prevents the historical purchase price from acting as a target without justification. The SEC’s investor education materials warn about behavioral patterns while emphasizing planning and diversification. This example is educational, not an investment recommendation. Its purpose is to distinguish a psychological reference from forward-looking evidence.
Use descriptive insight without turning it into a normative rule
Normative analysis asks what choice best advances stated goals under coherent assumptions. Prospect theory does not replace expected value, cash-flow analysis, diversification, legal duties or professional standards. A behavior can fit a descriptive pattern and still be sensible because the model omitted a constraint. Refusing a fair gamble may protect rent money. Holding an underwater position may reflect taxes or a long horizon rather than reluctance to realize a loss. Analysts should search for ordinary explanations before assigning a bias label, especially when judging someone else after the outcome is known.
Useful controls are procedural. Define goals and risk capacity before volatility, distinguish price from thesis, document what evidence would change a decision, and review framing in communications. For institutional choices, show outcomes relative to more than one reference and include absolute consequences. When presenting probabilities, pair percentages with frequencies and explain uncertainty. Most importantly, do not claim a universal twice-as-painful ratio. Prospect theory earns its value by making reference dependence and decision weighting visible, not by reducing every financial emotion to one constant.
- Identify the reference point and test how the choice appears under plausible alternatives.
- Treat the value curve as a descriptive model rather than a universal measure of pain.
- Separate probability weighting from loss aversion and show frequencies, denominators and uncertainty.
- Use current evidence, goals and constraints for normative decisions; do not anchor policy to purchase price alone.
- Avoid investment prescriptions based on a behavioral label or a single experimental parameter.
Sources
Keep exploring
- The Sunk-Cost Test: When Completion Is Rational and When Exit Creates Value →
How to separate irrecoverable spending from recoverable value, calculate forward NPV, recognize escalation incentives, and design exit rules.
- Frictionless Payments Without Hidden Costs: A Behavioral and Ethical Guide →
A careful guide to payment salience, coupling, evidence limits, transparent checkout, refunds, recurring consent, and ethical conversion measurement.
- First Principles Without Founder Mythology: A Method for Cost and Constraint Analysis →
How to decompose outcomes and costs, respect physics and regulation, test inherited assumptions, and validate delivery and manufacturing changes.