Behavioral Psychology & Decision Science
First Principles Without Founder Mythology: A Method for Cost and Constraint Analysis
First-principles analysis is a method for refusing to treat an inherited solution as a law of nature. It starts with an outcome, identifies constraints that cannot be negotiated away, separates them from assumptions that merely reflect current practice, and rebuilds a candidate process from measurable parts. The method does not guarantee a breakthrough or dramatic margin. Physics, safety, law, customer behavior and coordination remain real. Nor does it require a founder legend about one brilliant person seeing what an industry missed. Most useful decompositions are collaborative, empirical and mundane: time a handoff, weigh material, inspect a queue, price an error, then change one element. NASA systems engineering and NIST measurement guidance provide a more reliable model than mythology because they connect requirements, interfaces, verification and evidence.
By Farvenzo Explained · Published · 6 min read
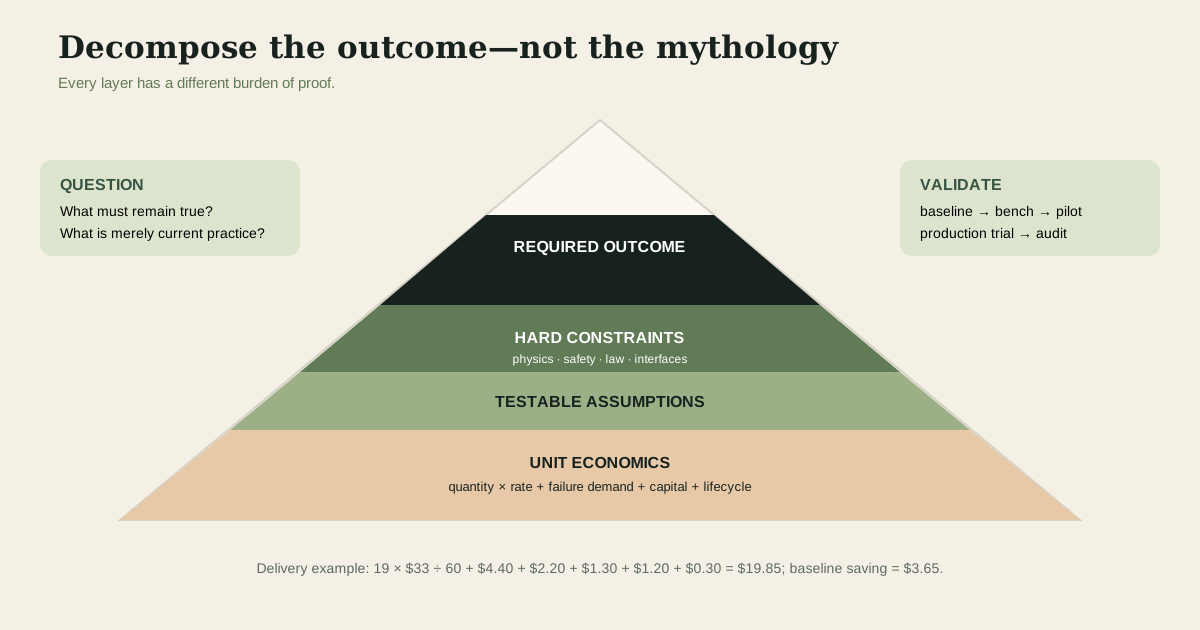
Begin with the required outcome and classify every constraint
A team should state the outcome in terms a user or system can verify. “Deliver a laboratory sample within four hours at the required temperature and chain of custody” is stronger than “modernize courier operations.” Next, list constraints: sample stability, transport law, recipient availability, tamper evidence, route time and acceptable failure probability. Some constraints are physical, some regulatory, some contractual and some economic. Each needs an owner and source. A rule quoted from memory may be a local habit; a validated temperature range in the product specification is not.
Assumptions sit beside constraints but receive a different label. The service may assume one driver carries one route, that dispatch occurs in hourly batches, that recipients sign on paper, or that vehicles return to a central depot. These choices may be sensible, yet they are testable. The point is not to challenge everything simultaneously. Rank assumptions by their contribution to cost or delay and by the ease of testing them. A small reversible experiment on a high-cost assumption is more useful than a workshop that declares the entire industry obsolete.
Decompose unit economics into quantities, rates and failure demand
A unit cost should show what scales with volume and what does not. For delivery, components might include pickup time, travel distance, handoff time, failed attempts, dispatch labor, vehicle cost, packaging, tracking, insurance and claims. Write each as a quantity multiplied by a rate where possible. “Operations: $12” hides the mechanism; “18 minutes of driver time at $30 per productive hour plus 6 miles at $0.55” can be challenged. Shared overhead can be shown separately so a redesign does not claim savings merely by reallocating fixed cost.
Failure demand is work created because the process did not work correctly: re-delivery, status calls, inspection, scrap, rework and refunds. It often hides outside the team that caused it. A cheaper component can raise total unit cost if it increases failure. Capacity also changes the equation. Removing ten minutes from a non-bottleneck step may not increase output, while reducing variation at the constraint can release meaningful throughput. Decomposition should therefore connect cost to flow, quality and the bottleneck rather than optimize each line independently.
Worked example one: rebuild a delivery service from its cost drivers
Consider an illustrative document-delivery service completing 1,000 jobs a month. Each job averages 22 driver minutes at $33 per productive hour, or $12.10; distance cost is $4.40; dispatch and customer-status work is $3.20; packaging and proof of delivery cost $1.30; failed attempts average $2.50. Direct unit cost is $23.50 before overhead. Analysis shows that recipients are unavailable because the service sends a two-hour arrival window only after dispatch. The inherited assumption is that route planning must precede customer confirmation.
The team tests confirmation before final route lock on 100 representative jobs. Driver time falls to 19 minutes, dispatch/status work to $2.20 and failed-attempt cost to $1.20, while software messages add $0.30. The arithmetic is 19 × $33 ÷ 60 + $4.40 + $2.20 + $1.30 + $1.20 + $0.30 = $19.85, a $3.65 reduction from the $23.50 baseline. The team does not multiply that difference by every future delivery immediately. It checks whether the trial shifted work to recipients, excluded urgent jobs, worsened route distance or failed during peak demand. Only then does it estimate scalable savings and required software cost.
Physics and regulation define the solution space
Sensitivity analysis identifies which assumptions deserve measurement next. In the bracket case, vary annual volume, tooling life, mature scrap, cycle time and qualification cost one at a time, then in plausible combinations. If the design creates value only at maximum volume and near-zero scrap, the business case is fragile. If it remains attractive across a broad range, management can focus on technical validation. Sensitivity is not a substitute for probability data, but it prevents one precise spreadsheet scenario from masquerading as a physical and commercial certainty.
Material strength, heat transfer, energy density, friction and tolerance are not negotiable through creative thinking, though designs can use them differently. A lighter package may need a different geometry to preserve stiffness. Faster charging may increase heat and battery degradation. In regulated work, validated cleaning, accessibility, financial controls or environmental permits can establish minimum processes. Teams should retrieve the actual requirement and understand its scope. “Compliance will not allow it” is not sufficient evidence, but neither is treating compliance as bureaucracy that vanishes when questioned.
Interfaces create another class of hard constraint. A new component must fit upstream tooling, downstream inspection, maintenance skills and customer use. NASA’s systems approach emphasizes requirements and verification across interfaces because local optimization can destabilize the whole. A redesign that reduces part count but requires a rare service tool may raise lifecycle cost. A digital workflow that eliminates signatures may fail where legal evidence or offline operation is necessary. First-principles reasoning grows stronger when specialists in engineering, operations, safety, legal and service test each other’s boundary claims.
Worked example two: redesign a manufactured bracket without inventing savings
An illustrative factory makes 20,000 aluminum brackets a year. The current unit uses $8.40 of material, $5.60 of machining time, $1.20 of finishing and $1.80 of expected scrap and rework, for $17 before allocated overhead. The bracket must carry a defined load, fit two interfaces, resist corrosion and pass a documented inspection. Engineers question the assumption that it must be machined from a solid block. They evaluate a near-net-shape process that uses $6.10 of material and $3.20 of machining but adds $1.70 of forming and $0.50 of new inspection.
The candidate direct cost is $11.50 before scrap, tooling and qualification. A prototype run shows expected scrap and rework of $2.40 while the forming process stabilizes, producing $13.90. Annual gross difference at stated volume is $62,000, but tooling costs $75,000 and validation $20,000. The first-year case is negative; later value depends on tool life, scrap improvement and demand. Completion of load, corrosion and interface tests is a gate, not an optional detail. The example shows how decomposition reveals an opportunity without turning it into a promise.
Validation distinguishes a first-principles hypothesis from a story
Validation begins with a baseline and a test protocol written before results. Define the unit, sample, operating range, quality limit and stop condition. Measure the current process using the same boundary that will be used for the alternative. If labor disappears from one department and appears in customer support, include it. If a new process needs capital, model utilization and ramp. NIST’s measurement guidance is relevant because repeatability, calibration, sampling and uncertainty determine whether a difference is real enough to act on.
A staged sequence limits exposure: bench test, small pilot, production-like trial, controlled rollout and post-launch audit. At each gate, compare performance with the required outcome and update the unit model. Record disconfirming results and residual risk. Analogy still has a role: standards and prior designs compress experience, and a known solution may be appropriate. First principles should decide which assumptions deserve retesting, not force novelty. The final design earns adoption through verified performance, maintainability and economics—not because its reasoning was described as reasoning from zero.
- Define the user or system outcome before discussing the inherited solution.
- Label physical, regulatory, contractual and interface constraints separately from testable assumptions.
- Express unit economics as quantities, rates, failure demand, capacity and lifecycle cost.
- Test high-value assumptions with staged experiments and prewritten success criteria.
- Rebuild only after the alternative passes quality, safety, compliance and full-cost validation.
Sources
Keep exploring
- The Sunk-Cost Test: When Completion Is Rational and When Exit Creates Value →
How to separate irrecoverable spending from recoverable value, calculate forward NPV, recognize escalation incentives, and design exit rules.
- Frictionless Payments Without Hidden Costs: A Behavioral and Ethical Guide →
A careful guide to payment salience, coupling, evidence limits, transparent checkout, refunds, recurring consent, and ethical conversion measurement.
- Prospect Theory Without the Two-to-One Myth →
How prospect theory describes reference-dependent choice without prescribing investments or asserting a universal loss-aversion ratio.